The partner home
Counters, the backup chart and the panel of DRs with problems in the last 24 hours, read in one go.
The home is the first page you land on when you enter the Console. It tells you whether something went wrong overnight without opening your DRs one by one.
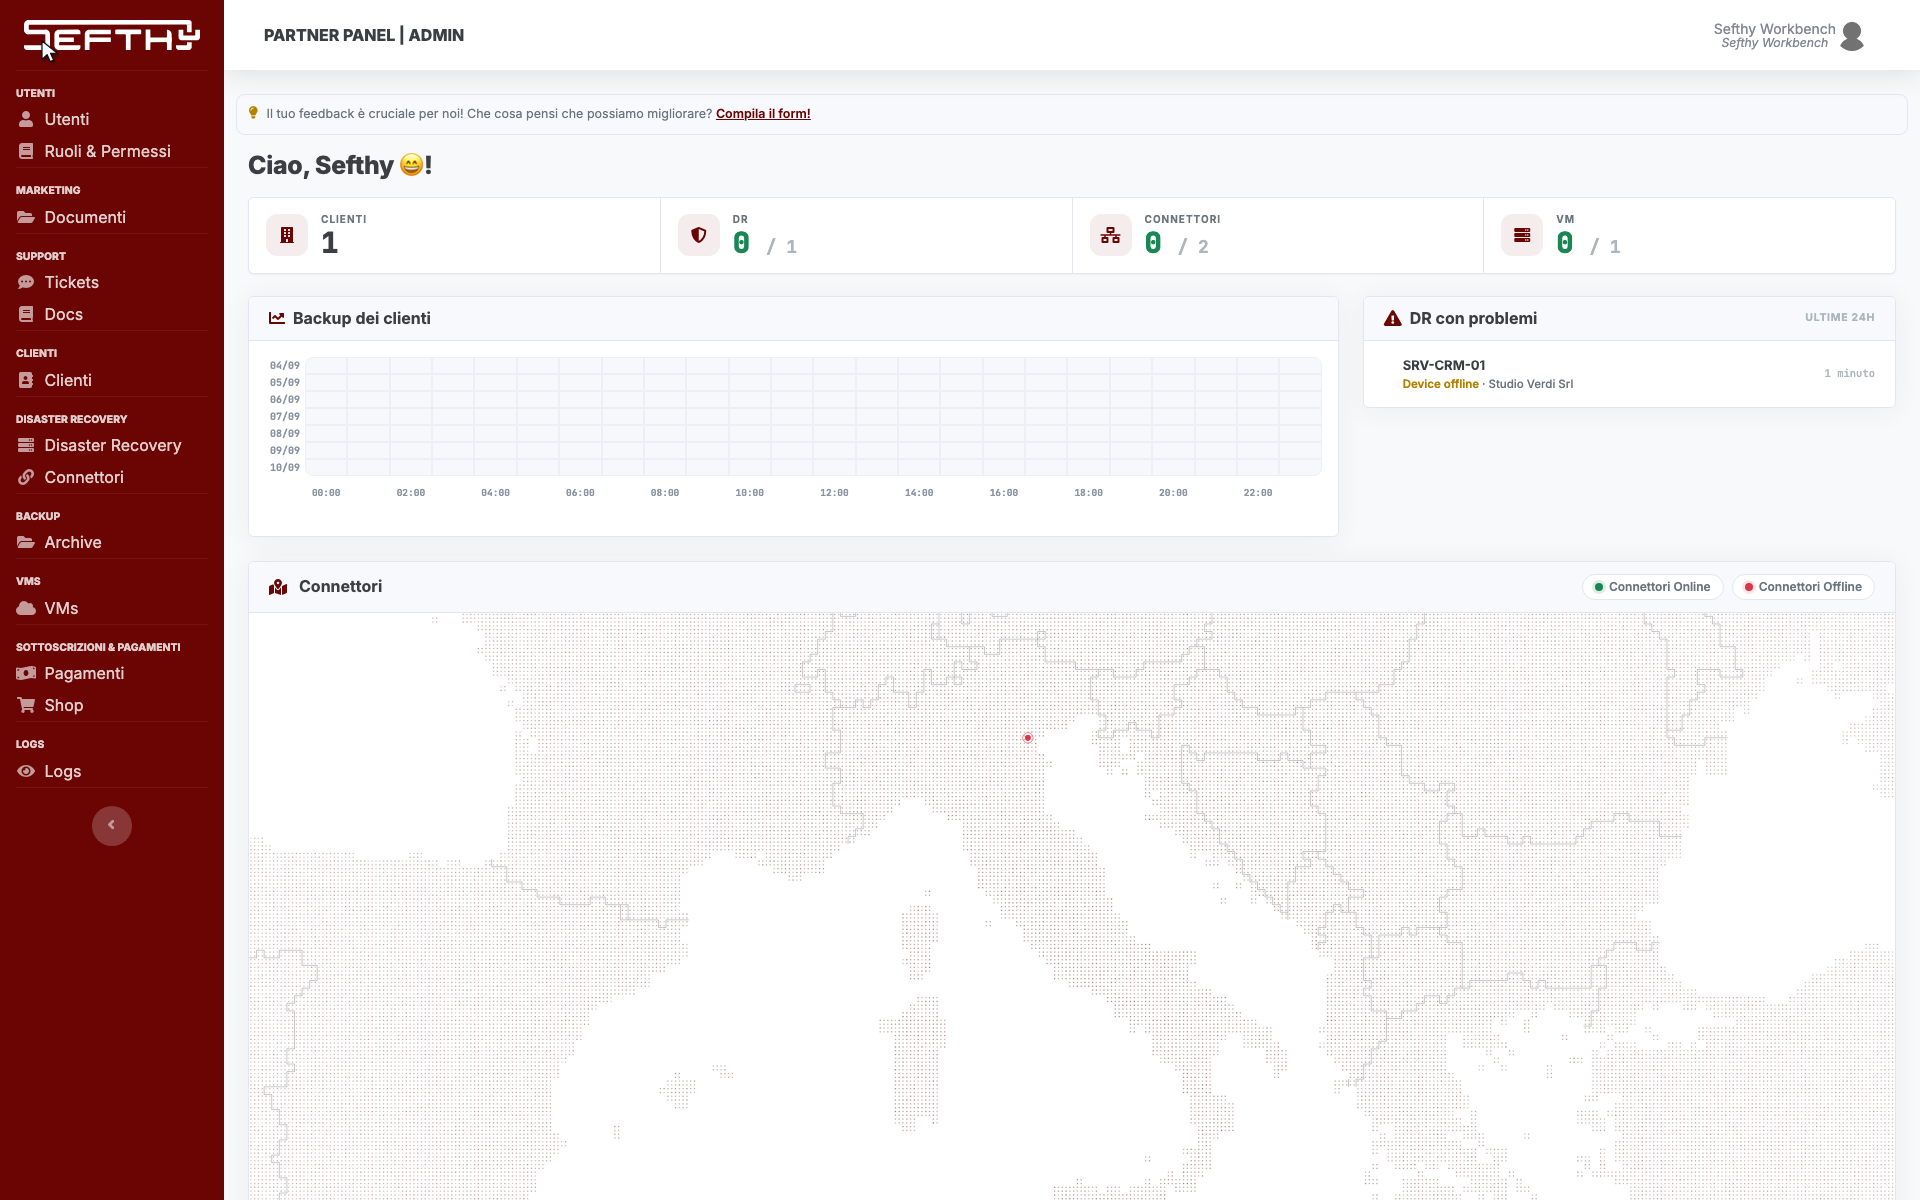
The counters at the top
Four tiles, one per resource type.
| Tile | What it counts |
|---|---|
| Customers | the customer companies you created under yours |
| DRs | the DRs whose protected server is answering right now, out of your total |
| Connectors | connectors online out of the total |
| VMs | virtual machines running out of the total |
Every tile is a link and takes you to the matching list.
My customer’s Backups
Below the counters you find the My customer’s Backups chart, which shows the outcome of the last seven days of backups split by day and by hour. It is the same grid you see inside a single DR page, except here it gathers all of yours.
The chart collects the DRs of your own company and of the customers sitting directly under it. A customer created under another customer stays out of the count. An empty chart means that none of the DRs in that perimeter has a connector, a Sefthy Agent and recorded backups yet.
DRs with problems
Next to the chart sits DRs with problems, labelled last 24h. Each row is one DR and shows the worst problem it had, the customer name and how long ago it happened. The dot on the left tells Alert, the serious case, from Warning.
Rows come from four different signals.
- Backups in the last 24 hours that ended badly, so Backup failed, Backup missed or Backup completed with warnings.
- Alerts already recorded on the DR, so No backup performed, Latest backup too old, Connector offline, Restore error, Orchestration paused and Storage over quota.
- The protected server not answering right now, which shows as Device offline.
- A pending network alignment proposal, which shows as Network change detected.
A DR takes a single row even when more than one signal fires. Device offline is not reported on DRs without a connector and on those with a restore under way, where a switched-off server is the expected state.
Click a row to open that DR page. If more than three DRs have problems, below the list you get +N more DRs with problems, which takes you to the full list. When there is nothing to report you read No problems in the last 24 hours.
The connector map
At the bottom of the page the map shows where the connectors you manage are. The legend tells Online Connectors from Offline Connectors.
What to do with it
The home is a summary, not an alerting system. If you want to be told when something happens, email alerts are switched on one by one from your profile, as described in Notifications Settings.